
Nhân tiện support 1 bạn học viên việc show trend graph trên allure-report, mình viết lại bài này để bạn nào gặp vấn đề tương tự có thể tự xử lý được.
Trend là 1 chart show thông tin các lần run để ai xem report có thể thấy sự phát triển hay thay đổi của automation test.
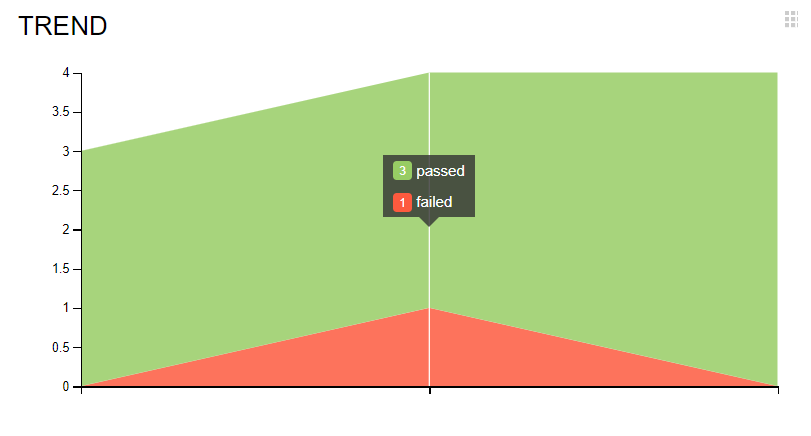
Để show được thì phải có dữ liệu lịch sử (history), mà để có dữ liệu lịch sử thì phải run test và tổng hợp vào 1 file nào đó. Ở đây, allure dùng folder history.
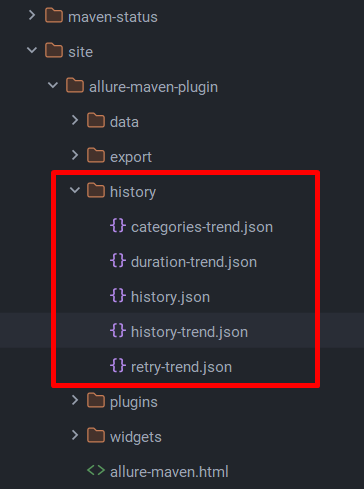
Dưới đây là các step để bạn sử dụng folder history này:
I. Run test lần đầu tiên
- Run test
mvn clean test - Create report
mvn allure:report - Copy folder
historyfromtarget/site/allure-maven-pluginvào 1 chỗ nào khác, vd:Desktop
II. Run test lần thứ 2
- Run test 2nd time:
mvn clean test - Copy folder
historyfromDesktoptotarget/allure-results - Create report
mvn allure:report - Open
target/site/allure-maven-plugin/index.html–> nhìn thấy trend lần 1 và lần 2 - Copy folder
historyfromtarget/site/allure-maven-pluginvào 1 chỗ nào khác, vd:Desktop
III. Run test lần thứ n
Làm giống như lần run test thứ 2.
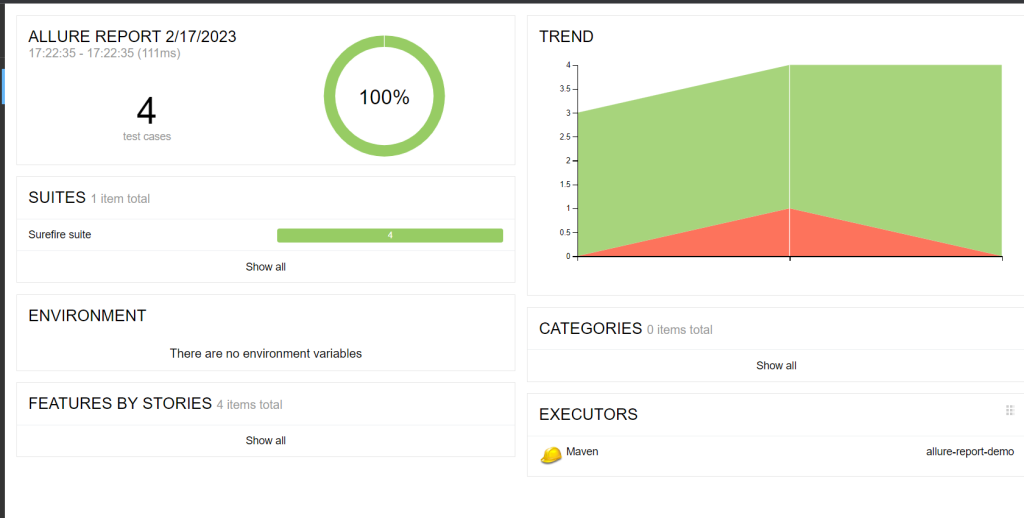
Dưới đây là thành quả sau 3 lần run test.
IV. Một vào điểm lưu ý
- Nếu bạn dùng TestNG thì dùng setup pom.xml theo bài này.
- Nếu bạn dùng JUnit5 thì dùng setup pom.xml theo bài này.